

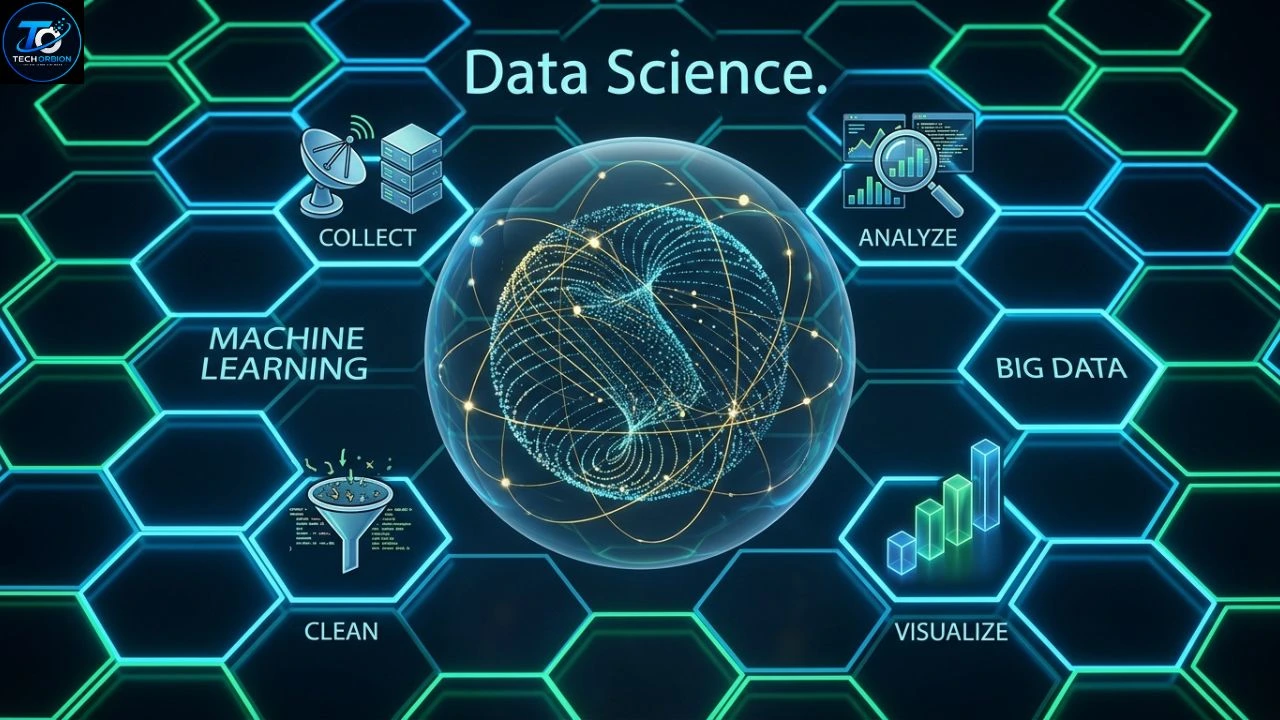
Data Science is one of the most useful fields in modern technology. Every day, people and businesses create huge amounts of information through websites, apps, phones, online stores, social media, and other digital services. But raw information alone is not very useful. It needs to be collected, cleaned, studied, and understood.
This is where data science becomes important. It combines areas such as statistics, programming, data analysis, artificial intelligence, and machine learning to find useful patterns and help people make better decisions.
You do not need to be a math expert to understand the basic idea. At its simplest, the goal is to take information that looks confusing and turn it into something useful. This guide explains what data science means, how it works, which tools are commonly used, where it is applied, and how beginners can start learning it.
Data science also involves collecting, analyzing, and interpreting information, which is closely related to data analytics.
Table of Contents
- What Is Data Science?
- How Does Data Science Work?
- Important Skills and Tools
- Real-World Uses and Benefits
- How to Start Learning Data Science
- Conclusion
- Frequently Asked Questions
What Is Data Science?
Data science is a field that uses scientific methods, programming, statistics, and analytical techniques to find useful information in data. A data scientist may work with numbers, text, images, customer records, website activity, sales information, or many other types of information.
The main purpose is not simply to collect information. The goal is to understand it and use it to answer questions or solve problems. For example, an online store may study its sales data to understand which products customers like most. A hospital may analyze patient information to find patterns that can help doctors make better decisions.
The field is broad because it brings several areas together. Statistics helps professionals understand patterns and uncertainty. Programming helps them process large datasets. Machine learning can help computers discover patterns and make predictions. Artificial intelligence can also be used as part of the workflow.
If you’re interested in this subject, don’t miss our [Quantum Computing] article.
Data Science vs. Data Analytics
These two terms are closely related, but they are not exactly the same.
Data analytics often focuses on examining existing information to answer questions such as what happened and why it happened. Data science is broader and can include predictive models, machine learning, programming, experimentation, and other advanced methods.
For example, imagine a website notices that sales dropped last month. An analyst might study the numbers and discover that fewer visitors purchased products. A data scientist might go further and build a model that estimates which customers are most likely to buy in the future.
| Data Science | Data Analytics |
| Broad field | More focused area |
| Can include machine learning | Often focuses on existing data |
| Can build prediction models | Often explains past results |
| Uses programming and statistics | Uses analysis and visualization |
| Can support automated systems | Often supports business decisions |
The two fields can overlap, and many professionals use skills from both areas.
How Does Data Science Work?
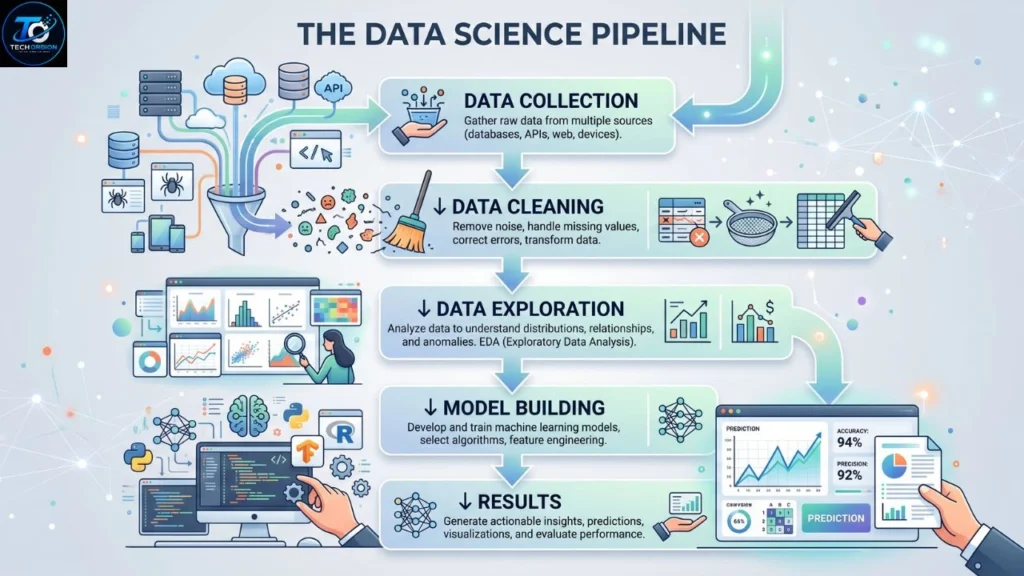
A successful project usually begins with a clear question. Without a good question, collecting large amounts of information may not solve the real problem.
For example, a company might ask, “Why are customers leaving our service?” The team then decides what information is needed to investigate the problem. This could include customer activity, subscription history, support requests, and other relevant records.
1. Collecting Data
The first step is gathering useful information. Data can come from many places, including websites, mobile applications, databases, surveys, sensors, business systems, and public datasets.
Not every piece of information is useful. A professional must decide what information is relevant to the question being studied. Good data collection also requires attention to privacy, security, accuracy, and responsible use.
2. Cleaning the Data
Raw data is often messy. It may contain missing values, duplicate records, spelling mistakes, incorrect numbers, or other problems.
Cleaning means finding and fixing these issues before deeper analysis begins. This step can take a lot of time, but it is extremely important. If poor-quality information is used, the final result may also be poor.
A simple example is a customer database containing the same person twice. If both records are counted, the business may believe it has more customers than it actually does.
3. Exploring the Data
After cleaning, the information can be explored. Professionals look for patterns, unusual values, relationships, and trends.
Charts and graphs can make this process easier. Instead of looking at thousands of numbers, a chart might quickly show that sales increase during certain months.
This stage helps professionals understand what the information is saying before they build complicated models.
4. Building Models
Some projects require prediction. This is where statistical models and machine learning can become useful.
A model learns from existing examples and can then be used to make estimates about new information. For instance, a company might use past sales records to estimate future demand.
However, a model is not automatically correct. It must be tested carefully. Professionals need to check whether the results are accurate and whether the model works well on information it has not seen before.
5. Communicating Results
Finding an interesting pattern is only part of the job. The result must also be explained clearly.
A business manager may not understand complex programming or statistics. A good data professional can turn technical findings into simple charts, reports, and recommendations.
The final goal is to help someone make a better decision.
Important Skills and Tools
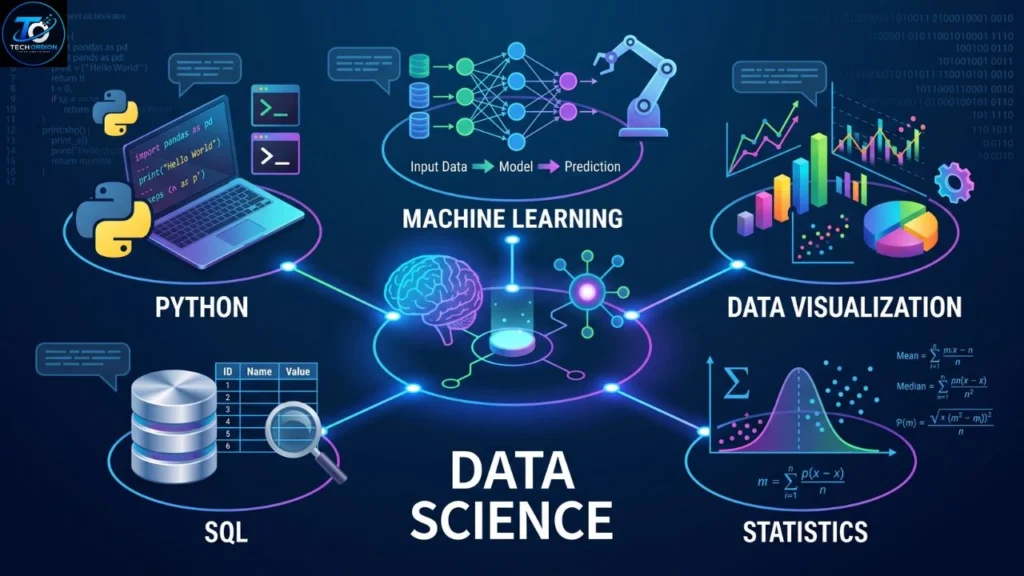
Python programming is widely used for data analysis, while SQL helps professionals work with databases. Data visualization makes complex information easier to understand.
Python
Python is one of the most useful programming languages for working with data. It has a simple syntax and a large ecosystem of tools for scientific computing, data processing, visualization, artificial intelligence, and machine learning.
Libraries such as Pandas, NumPy, and Matplotlib can help users work with datasets and create visualizations. Machine learning libraries can then be used for more advanced projects.
SQL
SQL is another important skill because many organizations store information in databases. SQL allows users to search, filter, combine, and summarize information stored in tables.
For example, a company might use SQL to find all orders made during the previous month or calculate the average value of customer purchases.
Statistics
Statistics helps professionals understand numbers and patterns. Basic topics include averages, percentages, probability, variation, and relationships between variables.
You do not need advanced mathematics on your first day. A strong understanding of basic statistics is a better starting point.
Data Visualization
Charts can make complicated information easier to understand. Bar charts, line charts, scatter plots, and other visual formats can show trends and relationships more clearly than a large table of numbers.
Good visualization is not about making a chart look fancy. It is about helping the reader understand the important information quickly.
Machine Learning
Machine learning is closely connected to this field, but the two terms should not be treated as identical. Machine learning focuses on methods that allow computers to learn patterns from data, while data science is a broader field that can include collecting, cleaning, analyzing, communicating, and using data.
A beginner should understand the difference because it helps create a better learning path.
Real-World Uses and Benefits
Data science is used across many industries because almost every modern organization creates or uses information.

Business and E-Commerce
Online stores can study customer behavior, sales, product demand, and website activity. This can help businesses understand what customers want and improve their services.
For example, an online store may notice that certain products sell more during a specific season. It can use that information to plan inventory and marketing campaigns.
Healthcare
Healthcare organizations can use information to study trends, manage resources, and support research. Data-driven systems may help professionals identify patterns in large collections of medical information.
Because health information is sensitive, privacy, security, accuracy, and responsible handling are especially important.
Banking and Finance
Financial organizations can analyze transactions, customer behavior, and market information. Data-driven systems can help detect unusual activity, estimate risks, and support financial planning.
The results should not be treated as perfect predictions. Financial decisions involve uncertainty, and models can make mistakes.
Transportation
Transportation companies can study traffic, routes, fuel use, schedules, and demand. This information can help improve planning and reduce wasted resources.
For example, a ride-sharing company can study demand in different areas to understand when more drivers may be needed.
Entertainment
Streaming services and other entertainment platforms can study viewing or listening behavior. This can help them understand what types of content users enjoy.
Recommendation systems are a common example. A service may use information about previous activity to suggest content that a user might find interesting.
Why Data Quality Matters
The quality of the final result depends heavily on the quality of the information being used.
If a dataset contains major errors, missing information, or unfair representation, a model may produce misleading results. This is why professionals must check data carefully instead of trusting every result produced by a computer.
How to Start Learning Data Science
Beginners can follow a simple Data Science learning path by starting with statistics, Python, SQL, and small practical projects.
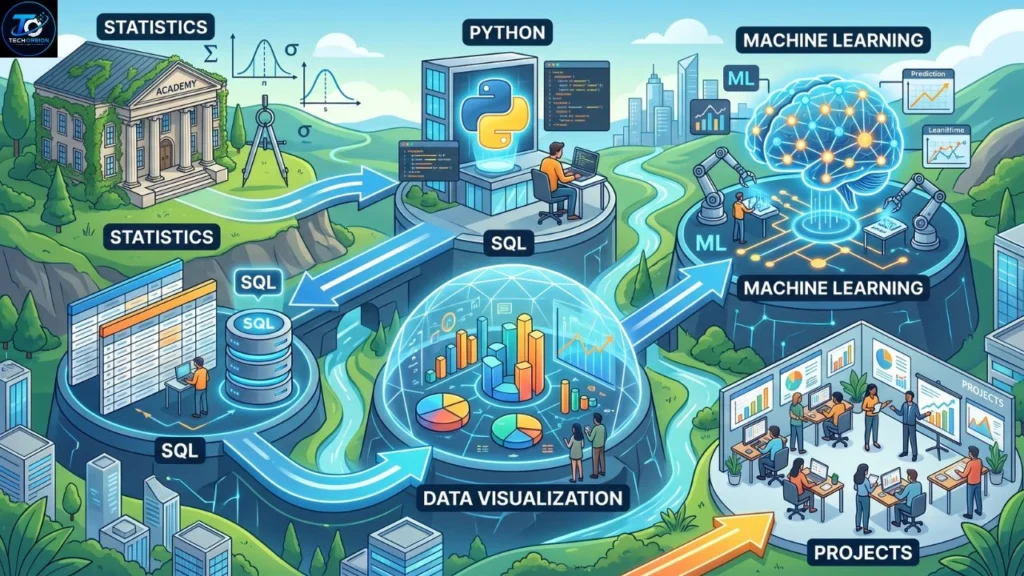
Step 1: Learn Basic Statistics
Start with averages, percentages, probability, distributions, and basic relationships between numbers. These concepts will make later topics easier to understand.
Step 2: Learn Python
Learn basic Python syntax, variables, conditions, loops, functions, lists, and dictionaries. After that, start working with libraries commonly used for data tasks.
Python’s official documentation provides tutorials and learning resources for people who want to understand the language.
Step 3: Learn SQL
Practice simple database queries. Learn how to select information, filter rows, sort results, group data, and combine tables.
Step 4: Practice With Real Datasets
Reading about data is useful, but practice is even more important. Try small datasets and ask simple questions.
For example:
- Which month had the highest sales?
- Which product was purchased most often?
- Which category grew fastest?
- Are there missing values?
- What trend can you see in the data?
Kaggle provides learning resources and practical exercises covering areas such as SQL, machine learning, deep learning, and data visualization.
Step 5: Build Small Projects
Projects help turn knowledge into practical skills. A beginner could create a sales analysis project, movie recommendation experiment, customer behavior report, or simple price prediction model.
Do not worry about making the first project perfect. The goal is to learn how to move from a question to data, analysis, results, and a clear explanation.
Step 6: Learn Machine Learning
Once you understand basic data handling and statistics, you can begin learning machine learning. Start with simple concepts before moving to deep learning or complex artificial intelligence systems.
A strong foundation makes advanced topics much easier to understand.
Common Mistakes Beginners Should Avoid
One common mistake is trying to learn too many tools at the same time. Beginners sometimes install dozens of programs and libraries without understanding the basic ideas behind them.
It is better to learn a small number of tools well. For example, you could begin with Python, SQL, basic statistics, and one visualization tool.
Another mistake is focusing only on certificates. Courses can provide structure, but practical skills come from solving problems. A person who can explain a project clearly and show how they worked with real information has something useful to demonstrate.
Finally, do not ignore communication skills. A technically correct result is not very helpful if nobody understands it. Good professionals can explain their findings in simple language.
Data science combines statistics, programming, analytics, and machine learning to turn data into useful insights. IBM also explains data science as a field that combines multiple disciplines to extract useful insights from data.
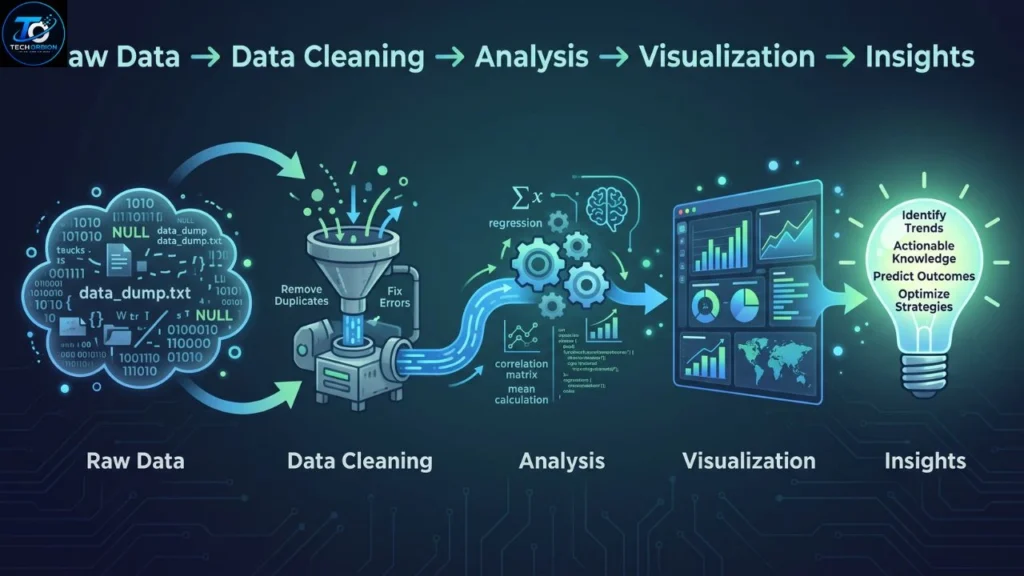
A data scientist may begin with raw data and perform data cleaning before using statistical methods to find useful patterns.
Conclusion
Data Science is a broad technology field that helps people turn raw information into useful knowledge. It combines programming, statistics, analysis, visualization, and sometimes machine learning and artificial intelligence to solve real problems.
The field can look difficult at first, but beginners do not need to learn everything immediately. Start with basic statistics, learn Python and SQL, practice with small datasets, and slowly move toward machine learning.
The most important skill is not memorizing every tool. It is learning how to ask good questions, work carefully with information, find meaningful patterns, and explain the results clearly. With regular practice, even a complete beginner can build a strong foundation and continue toward more advanced topics.
Frequently Asked Questions
1. What is Data Science in simple words?
It is the process of using data, programming, statistics, and analytical methods to find useful information and solve problems.
2. Is Data Science difficult for beginners?
It can seem difficult at first because it combines several subjects. However, beginners can learn it step by step by starting with basic statistics, programming, and data analysis.
3. Do I need to be good at mathematics?
You need some mathematics and statistics, but you do not need to be an advanced mathematician to begin. Basic concepts are enough for a beginner starting out.
4. Is Python important for Data Science?
Python is very useful because it has a large collection of libraries for data processing, visualization, scientific computing, and machine learning.
5. Should I learn Python or SQL first?
Python is a good general starting point, but SQL is also very important for working with databases. Learning both will give you a stronger foundation.
6. What is the difference between Data Science and Machine Learning?
Data science is a broader field that can include collecting, cleaning, analyzing, and communicating information. Machine learning is a set of techniques that allows computers to learn patterns from data.
7. Can I learn Data Science without a computer science degree?
Yes. Many people begin through self-study, online courses, practical projects, or other learning paths. A degree can be useful for some jobs, but practical knowledge and problem-solving skills are also important.
8. What tools should a beginner learn?
A useful starting set includes Python, SQL, spreadsheets, basic statistics, and data visualization. Later, you can explore machine learning and other specialized tools.
9. Where can I practice?
You can practice with public datasets and learning platforms. Kaggle offers practical learning resources for areas such as SQL, machine learning, and data visualization.
10. Is Data Science still useful in the age of AI?
Yes. AI systems depend heavily on data, and professionals still need to collect, clean, understand, evaluate, and communicate information. AI can become another tool within a broader data workflow rather than replacing the entire field.
